NCT/UCC MALDI Imaging Unit

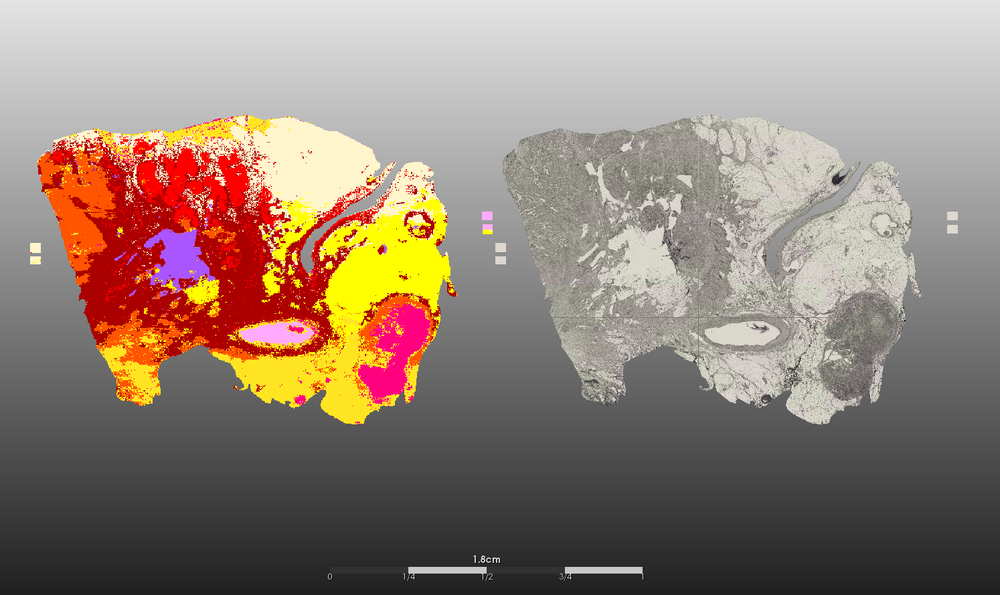
In addition to the significance of conventional MALDI analysis for routine diagnostics and for medical research projects using experimental setups, the MALDI Imaging Unit researches bioinformatic workflows and deep learning pipelines to utilize big data e.g. for automation purposes.

Research focus
- Tumor classification of rare tumor types
- Segmentation of (intra-)tumor heterogeneity
- Lipid, protein and peptide mass spectra identification of novel tumor subtypes
- Generation of an ever-growing database of tumor vs normal tissue mass spec data
- MALDI segmentation pipelines based on deep learning
- 3D MALDI imaging approaches
Sample types for MALDI imaging:
- Fresh frozen tissue
- Formalin-fixed paraffin-embedded (FFPE) tissue
- Samples with and without on-slide enzymatic digestion
- Embedded organoids, spheres or cell culture blocks
Technical information:
- Positive and negative flight mode detected by linear or reflector detector
- Mass range (positive mode e.g. peptides: 600-3200 m/z, proteins 1000-500,000 m/z)
- Scan range: 5x5µm to 150x150µm resulting field size
- Automated batch run option
- External calibration and quality controls provided
- Big data storage (data files from 20 to 100GB)

Figure 3: Mass spectra of tumor region. Example of one mass spectra pattern in a range of 600-3200 m/z of a tumor region (FFPE sample).
Coordination
Dr. rer. med. Pia Hönscheid
Group leader
E-Mail: pia.hoenscheid(at)ukdd.de
Phone: +49 (0)351 45813038
Director
Prof. Dr. med. Gustavo Baretton
Director of Institute of Pathology Dresden
E-Mail: Gustavo.Baretton(at)ukdd.de
Phone: +49 (0)351 4583000
Team
Christian Sperling
Medical Technical Assistant
E-Mail: Christian.Sperling(at)ukdd.de
Phone: +49 (0)351 458-13009
Maximilian Weiss
Physician in further education
E-Mail: Maximilian.Weiss(at)ukdd.de
Phone: +49 (0)351 458-5266


